AI Analytics — Know What's Working
AI Analytics — Know What's Working
Read your numbers, understand your audience, and make smarter decisions. No spreadsheet degree required.

"Most business owners post content and have no idea if it is working. This changes today."
The Posting-and-Hoping Trap
You post every day. You create content. You reply to comments. But do you know which post actually brought you a customer?
Here is the truth: data is not scary. It is just a story your customers are telling you — if you know how to listen. The problem is not that you lack numbers. The problem is that the numbers are buried inside complicated dashboards designed for Silicon Valley engineers, not Lagos business owners.
Today, AI reads those numbers for you. It translates spreadsheet chaos into plain English. It tells you: "This post made you money. That post wasted your time. Do more of this. Stop doing that."
Do This Now
Open your phone. Check your last 10 social media posts. Can you name which one brought the most messages or sales? If not, you are flying blind — and this lesson fixes that.
Your Analytics Toolkit
Four tools. Two are free. All work in Nigeria. Pick based on what you need to know.
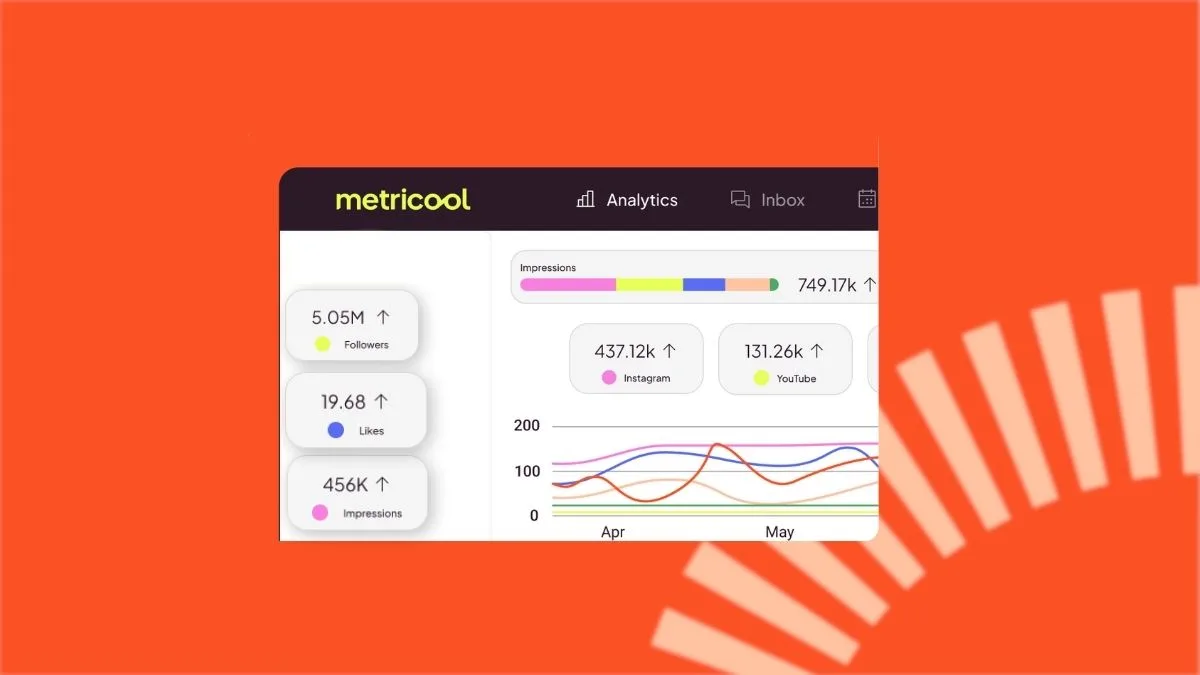
Metricool
FREE TIERConnects Instagram, Facebook, TikTok, Twitter, LinkedIn in one dashboard. See which post got the most reach, clicks, and comments — all color-coded.
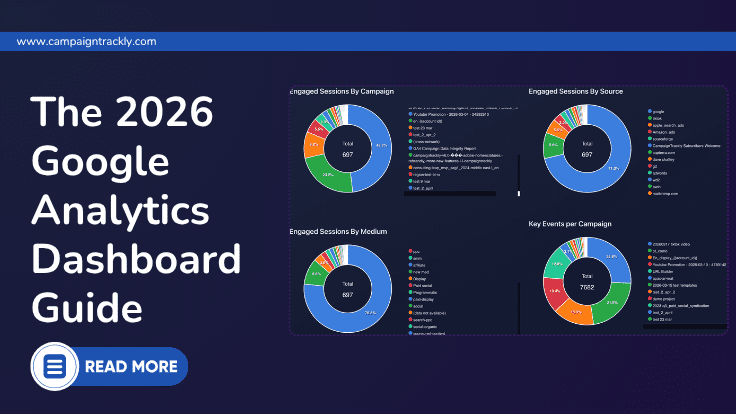
GA4 + Gemini
FREETracks who visits your website, where they come from, and what they do. Gemini reads the data and explains it in plain language.

Perplexity AI
FREEAsk questions about your industry, competitors, or trends. Searches the web in real-time with sourced answers.
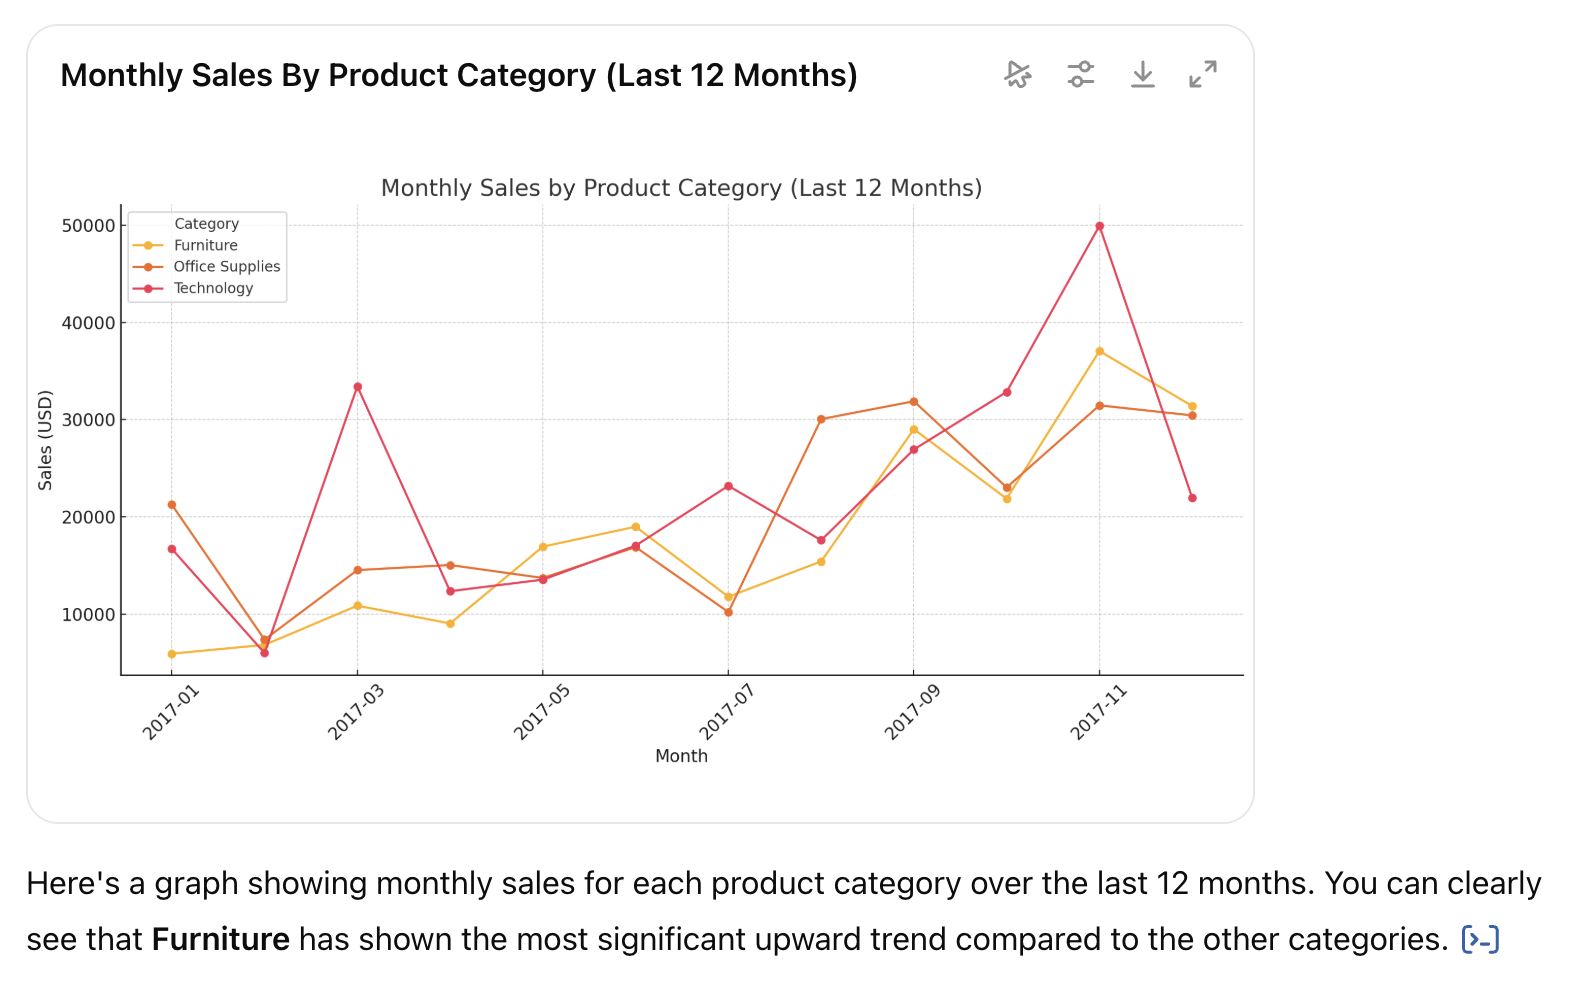
ChatGPT Analyst
FREE TIERUpload your Metricool CSV or GA4 export. ChatGPT creates charts, finds patterns, and writes plain-English summaries.
How to Read Metricool in 5 Minutes
Metricool is the simplest tool for social media analytics. Here is exactly what to click and what to look for.
Connect Your Accounts
Sign up at metricool.com, click "Add Social Profile" and connect Instagram, Facebook, TikTok, Twitter. Takes 2 minutes.
Open Analytics Tab
Left sidebar click "Analytics." Green = growth. Red = decline. Yellow = flat.
Find Your Top Post
Scroll to "Top Performing Posts." The top post = winning formula. Screenshot it.
Check Best Time to Post
Look for "Best Hours" or "Heatmap." Darker colors = more audience online.
Export Data
Click download arrow → Choose CSV. Save to your phone. You'll upload to ChatGPT.
Nigerian Tip
Metricool works on mobile browsers, but desktop view is clearer. Rotate to landscape and pinch to zoom on graphs.
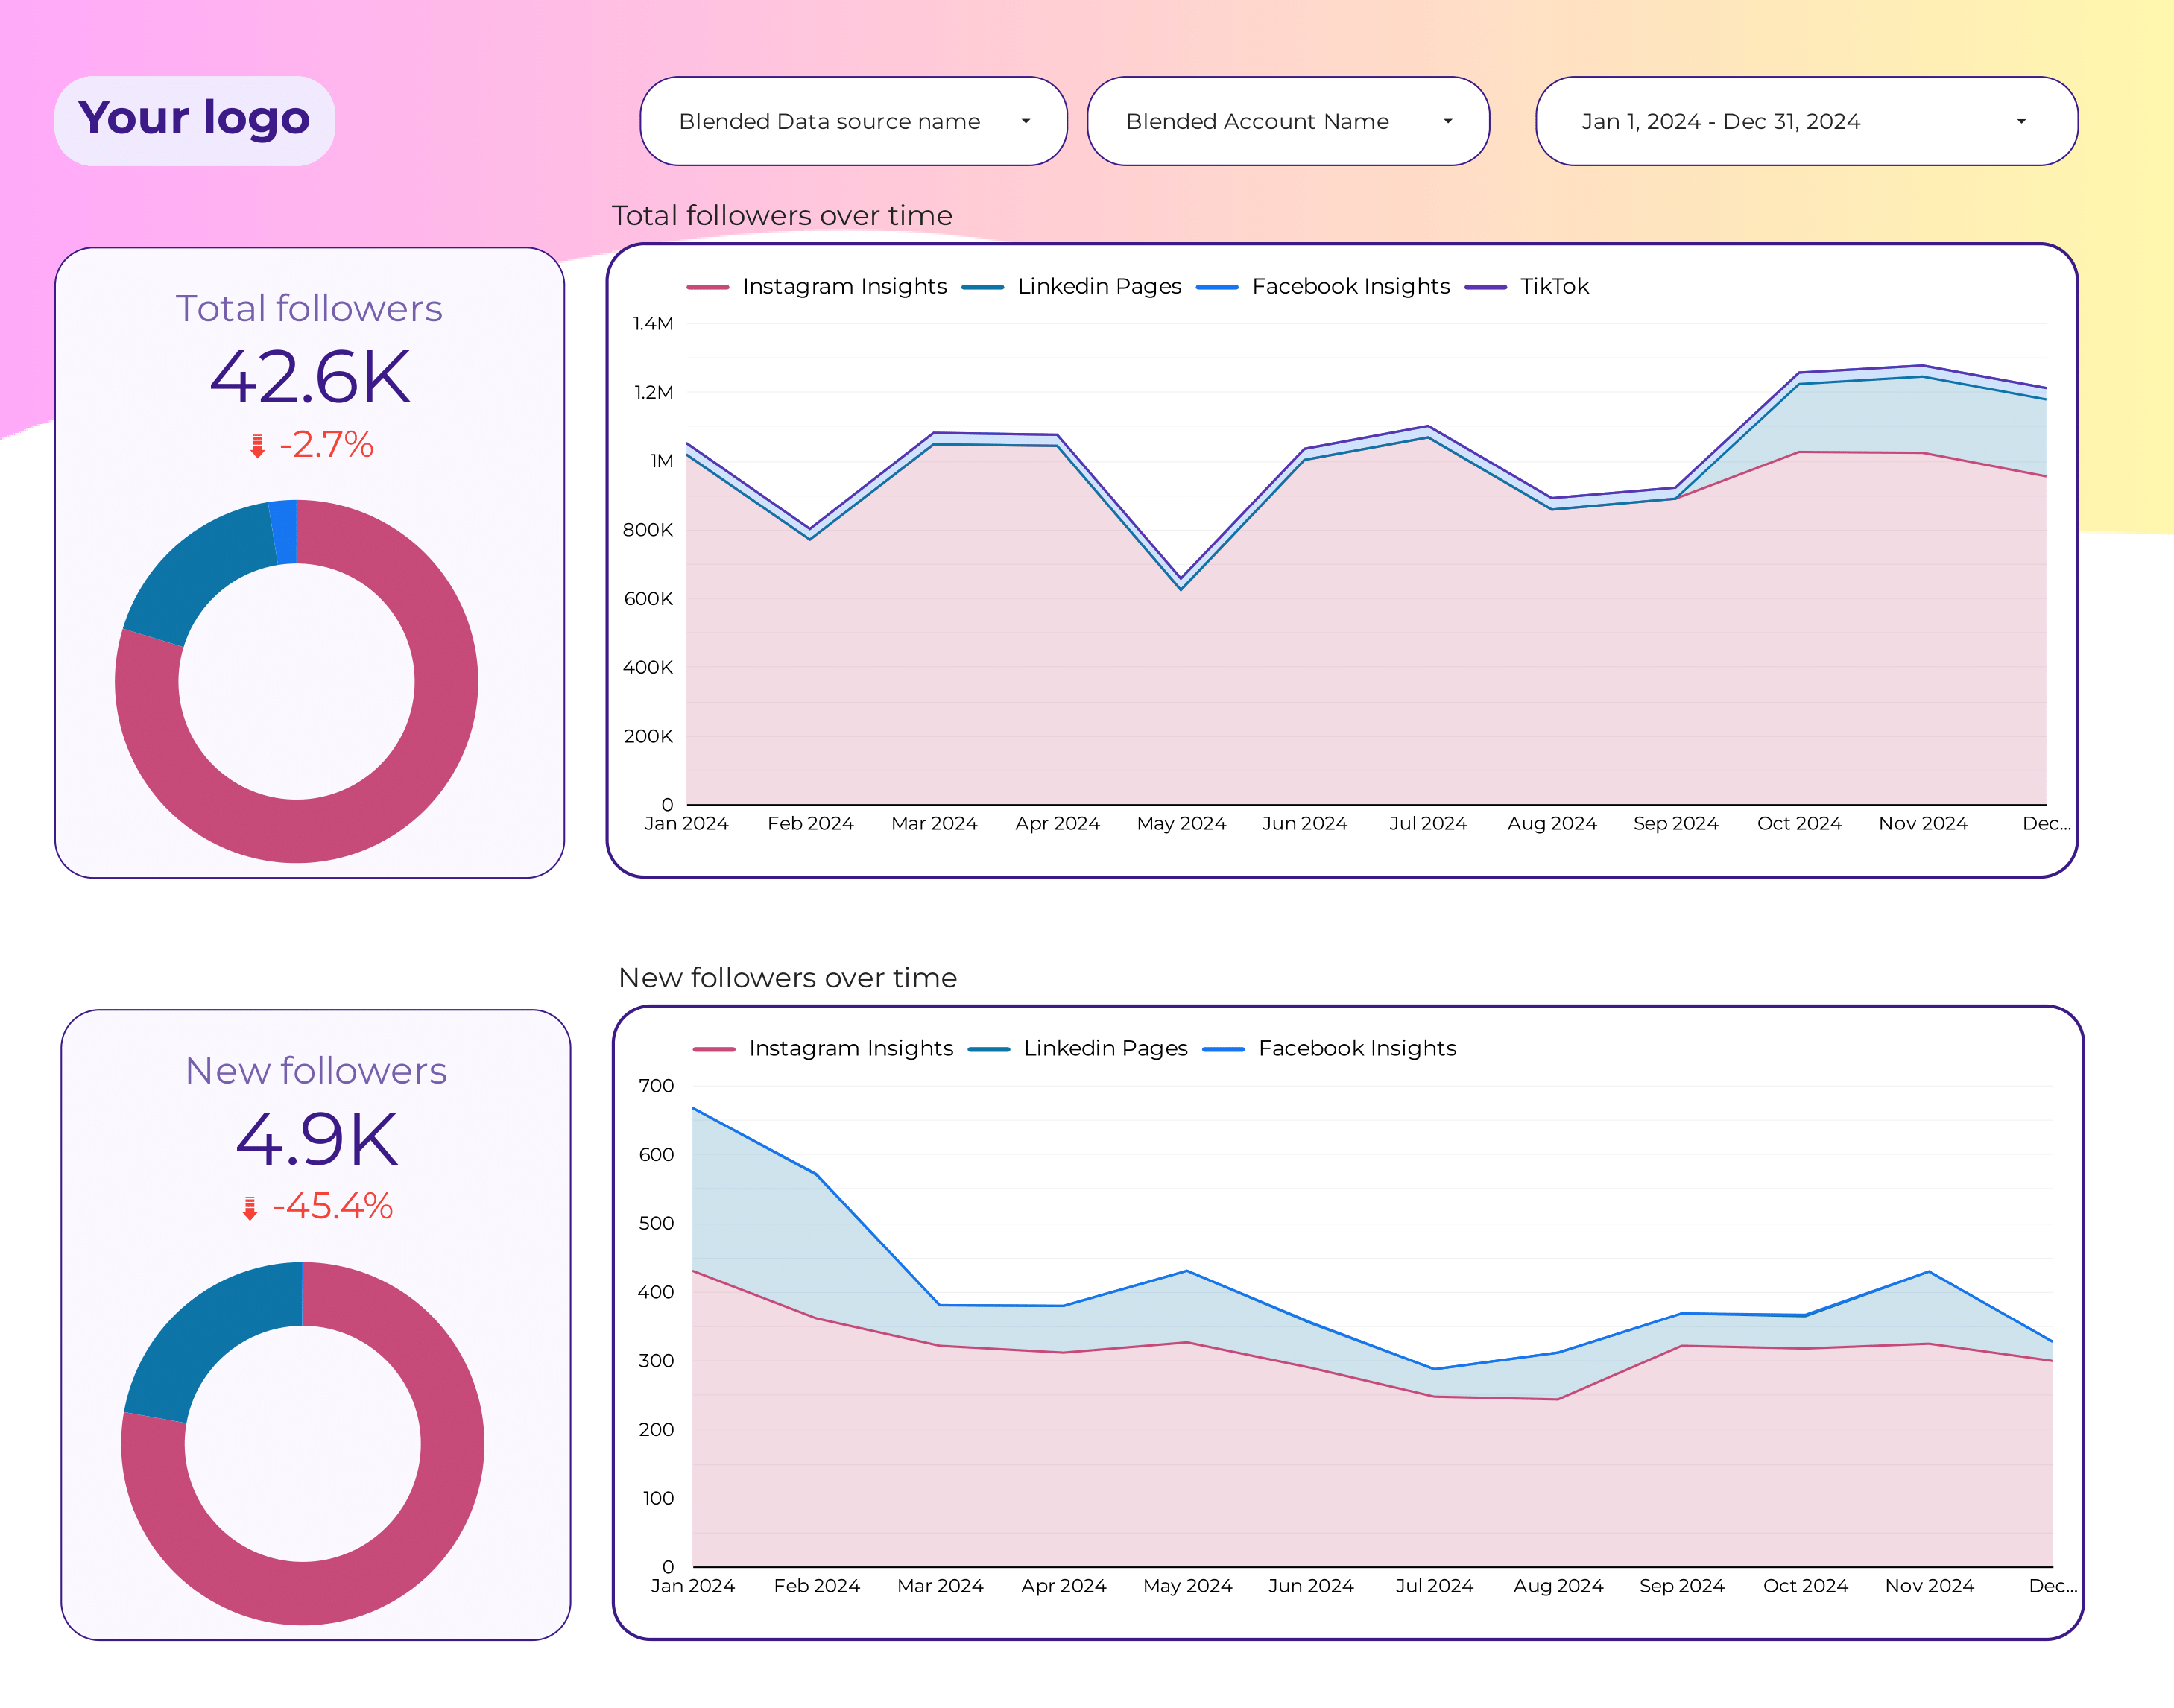
Google Analytics + Gemini: Let AI Explain Your Website
If you have a website, GA4 tracks who visits. Gemini reads your data and explains it in plain English.
Where Visitors Come From
Reports → Acquisition → Traffic Acquisition. Look at "Session source."
What They Click
Reports → Engagement → Events. Most clicked button = hottest lead source.
Ask Gemini to Explain
Click the Gemini sparkle icon. Ask: "Why did my traffic drop?"
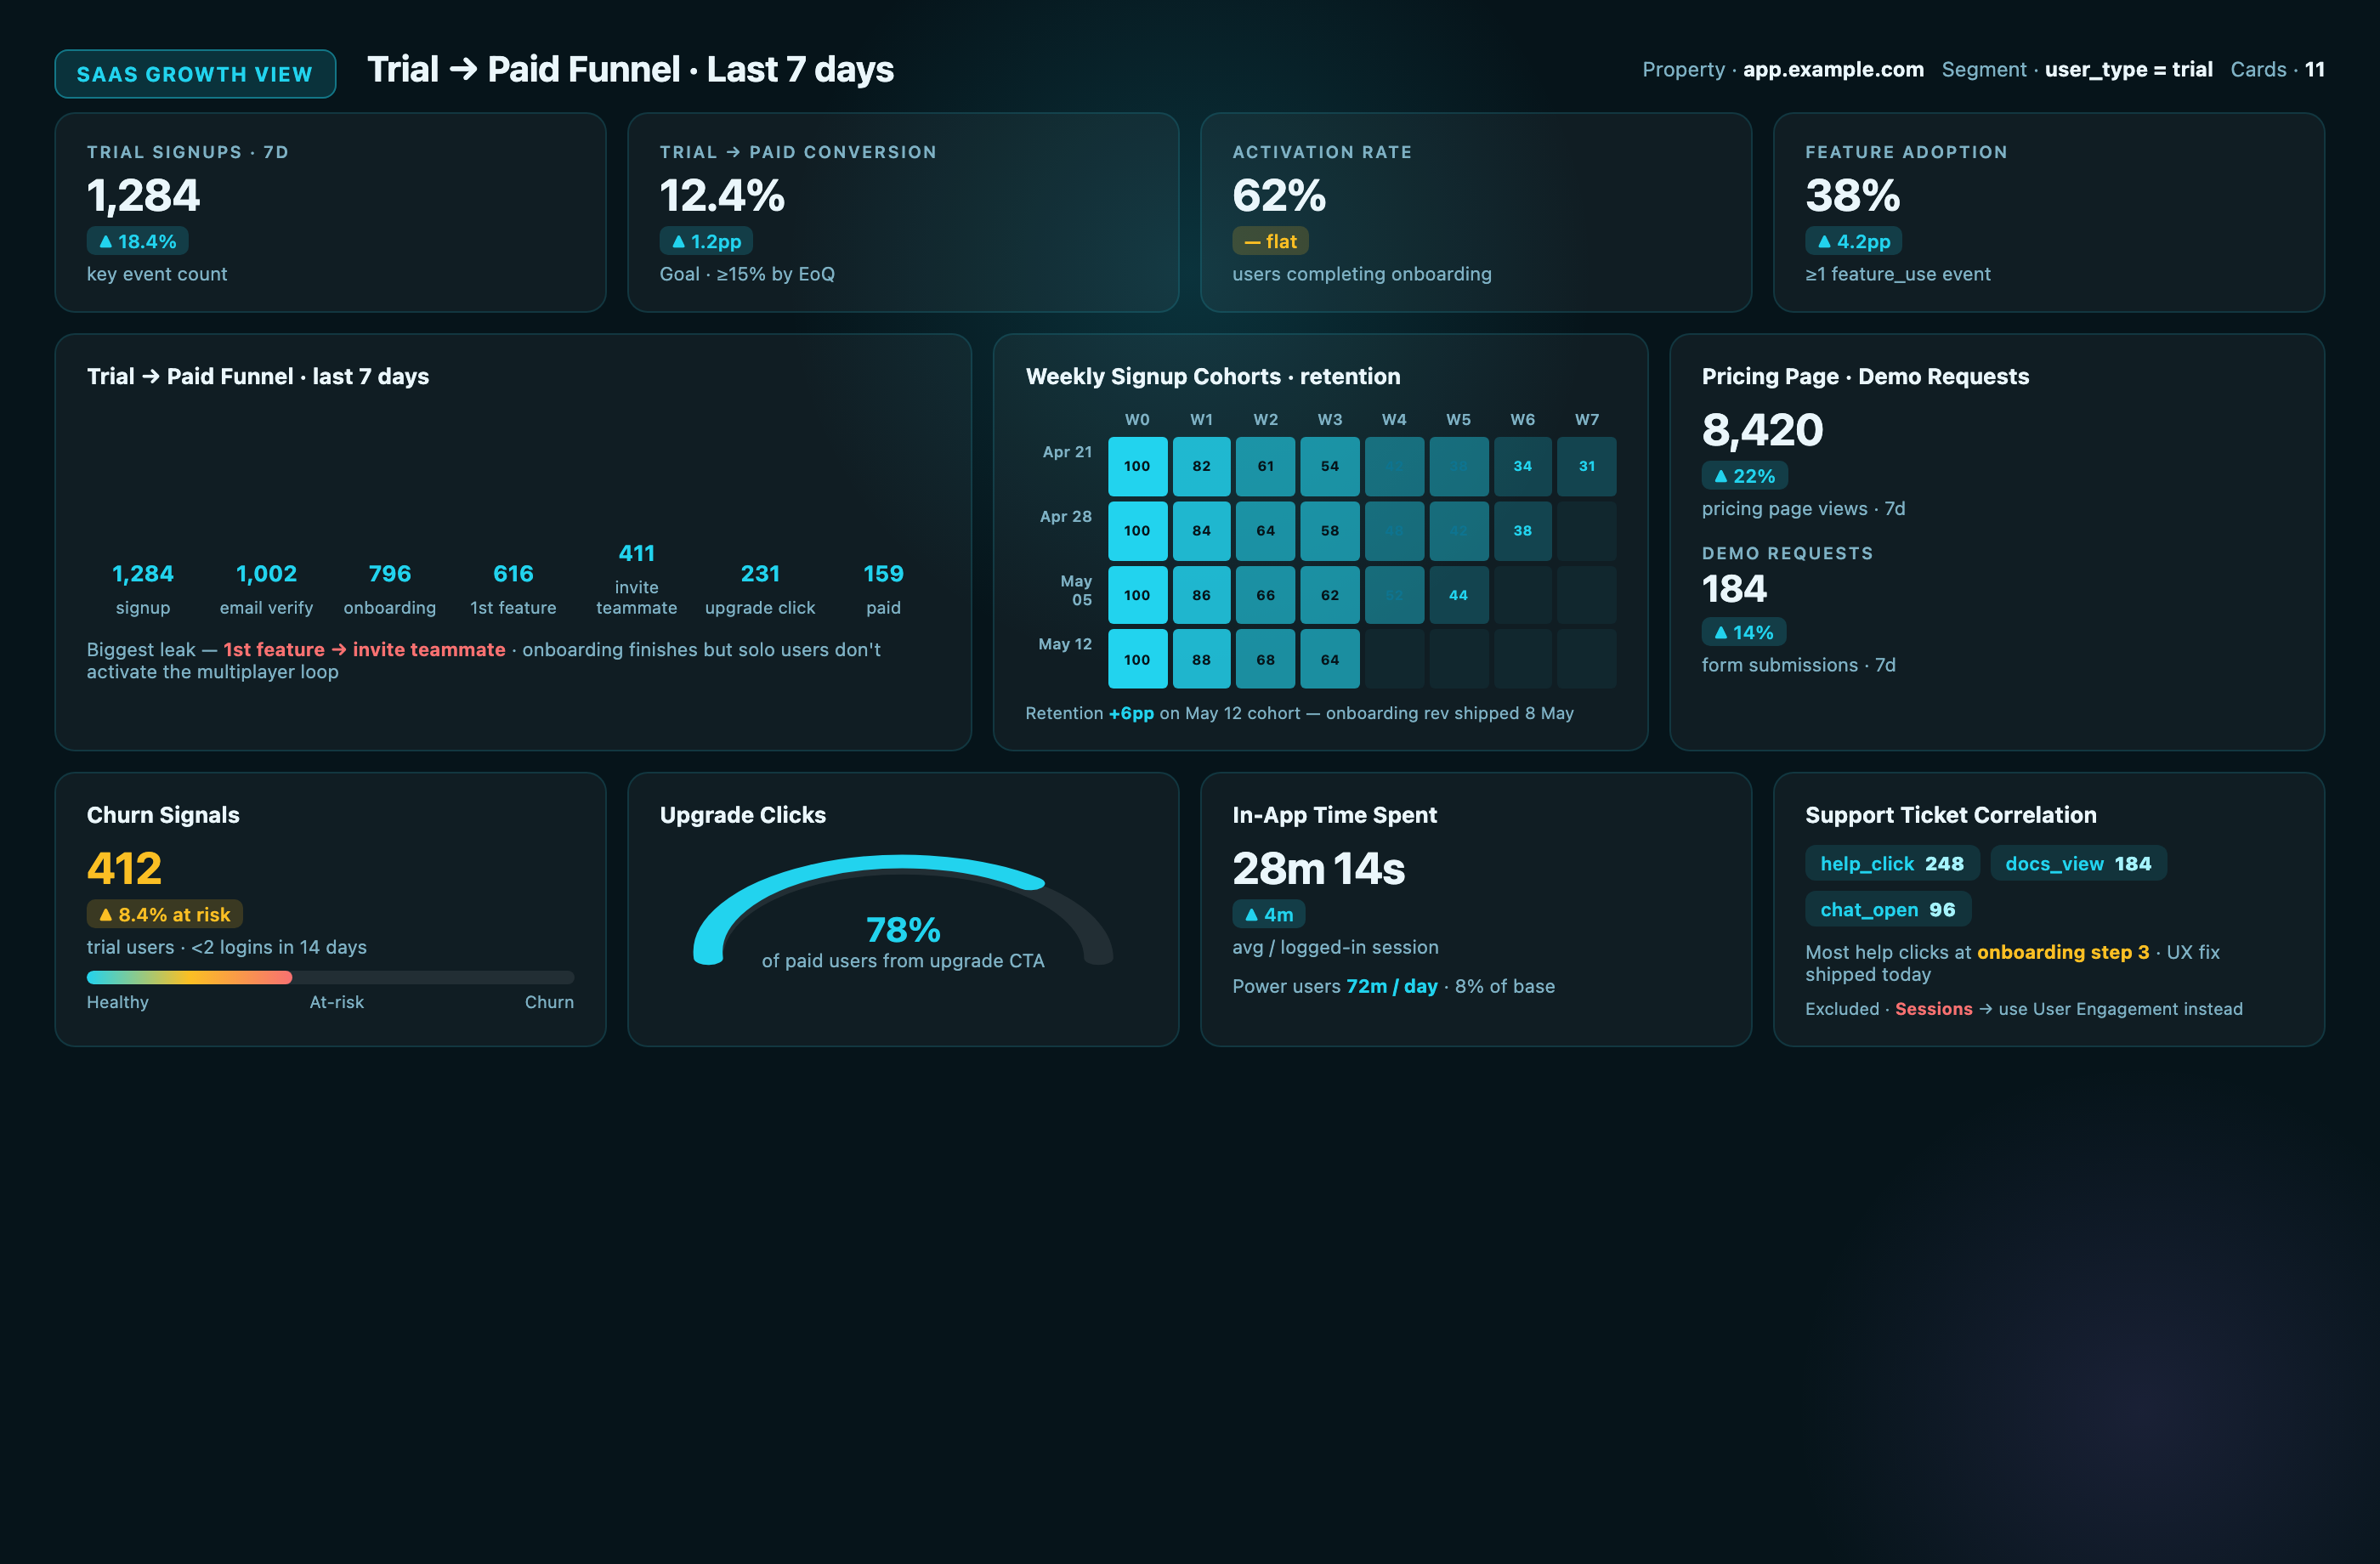
The 3 Numbers That Matter
Let AI Read the Numbers for You
Upload your data. Ask a question. Get a plain-English answer with charts.
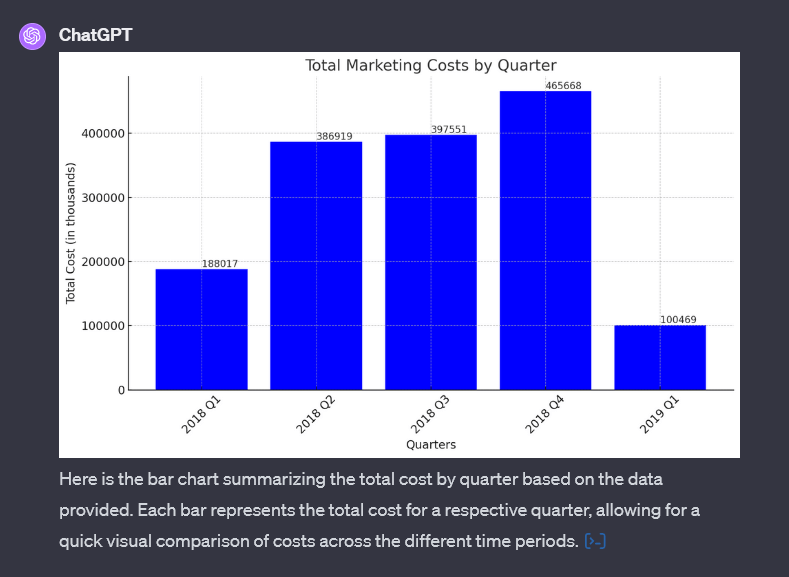
The ChatGPT Report Method
Export Metricool or GA4 as CSV
Go to chatgpt.com, click paperclip to upload
Paste the prompt (copy-ready below)
"I am a [business] owner in Nigeria. Here is my 30-day social media data. Tell me: 1) My top-performing post type, 2) My best posting day and time, 3) What I should stop doing, 4) What I should double down on. No jargon."

The Gemini Quick-Ask Method
Open Google Analytics 4
Click Gemini sparkle icon (top right)
Ask any question directly
"Why did my website traffic drop last week?"
"Which social platform sends me the most buyers?"
"What time do Nigerians visit my site most?"
The Result
Within 60 seconds, you get plain-English summary: "Post more videos on Tuesday at 7 PM. Stop posting product photos without people."
The Monday 15-Minute Review
This habit separates growing businesses from stagnant ones. Same time. Same place. Every Monday morning.
Your Monday Checklist
Check Last Week's Reach (3 min)
Open Metricool. Total reach vs. week before.
Identify the Winner (3 min)
Which post got most engagement? Screenshot.
Count Conversions (3 min)
WhatsApp messages, calls, sales from social.
Spot the Loser (3 min)
Lowest reach post. Do not repeat that format.
Decide This Week's Focus (3 min)
What will you post more of? What will you stop?
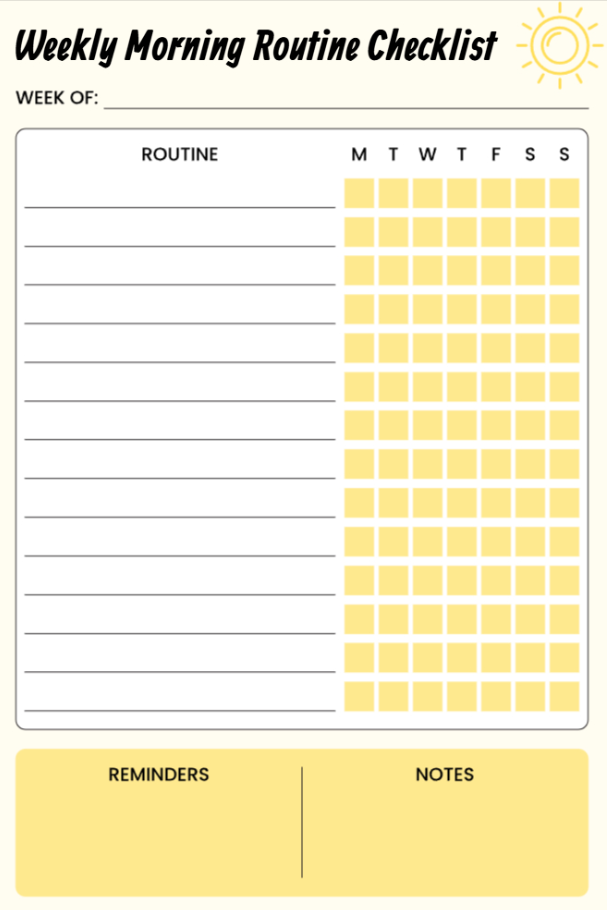
This Week's Decision Template
Fill out every Monday. Takes 60 seconds.
[e.g., Reels at 7 PM, testimonials]
[e.g., Plain product photos]
[e.g., Behind-the-scenes video]
The Rule of One
Never leave Monday review without ONE specific change. "This week, I will post one testimonial video every Wednesday at 7 PM." Do that for 4 weeks.
Build Your Weekly Brand Health Dashboard
One screen. Five numbers. Checked every Monday. This is your command center.
How to Build It (Free Options)
Option A: Google Sheets
Simple table with 5 columns (Reach, Engage, Click, Lead, Sale) and one row per week. Metricool auto-exports monthly.
FREE · Best for beginnersOption B: Notion
Create a "Brand Health" database with date, platform, and 5 metrics. Add gallery view with weekly top post screenshots.
FREE · Best for visual thinkersOption C: ChatGPT + Image
Every Monday, screenshot Metricool dashboard. Upload to ChatGPT: "Summarize my week in 3 bullet points."
FREE · Best for busy ownersUpload 30 Days of Data. Get Your AI Report.
Export Your Data
Metricool → Analytics → Download CSV (last 30 days). Or screenshot Instagram Insights.
Upload to ChatGPT
chatgpt.com → New chat → Paperclip icon → Upload your CSV or screenshot.
Paste the Magic Prompt
"I run a [business] in [city], Nigeria. Here is my last 30 days of social media data. Write a performance report including: 1) Top 3 posts and why they worked, 2) Worst post and what to avoid, 3) Best day/time to post, 4) Three content ideas for next week, 5) One sentence on whether I am growing. No jargon."
Save the Report
Copy response → Paste into Notes app or WhatsApp "Saved Messages." Read it daily this week.
Day 9 Deliverable
A custom AI-generated performance report for your last 30 days, plus a written commitment to your Monday 15-minute review habit.
Complete this lesson
Mark as complete to track your progress